FloodTraces: Turning Digital Traces into Flood Response Intelligence
28 July 2025
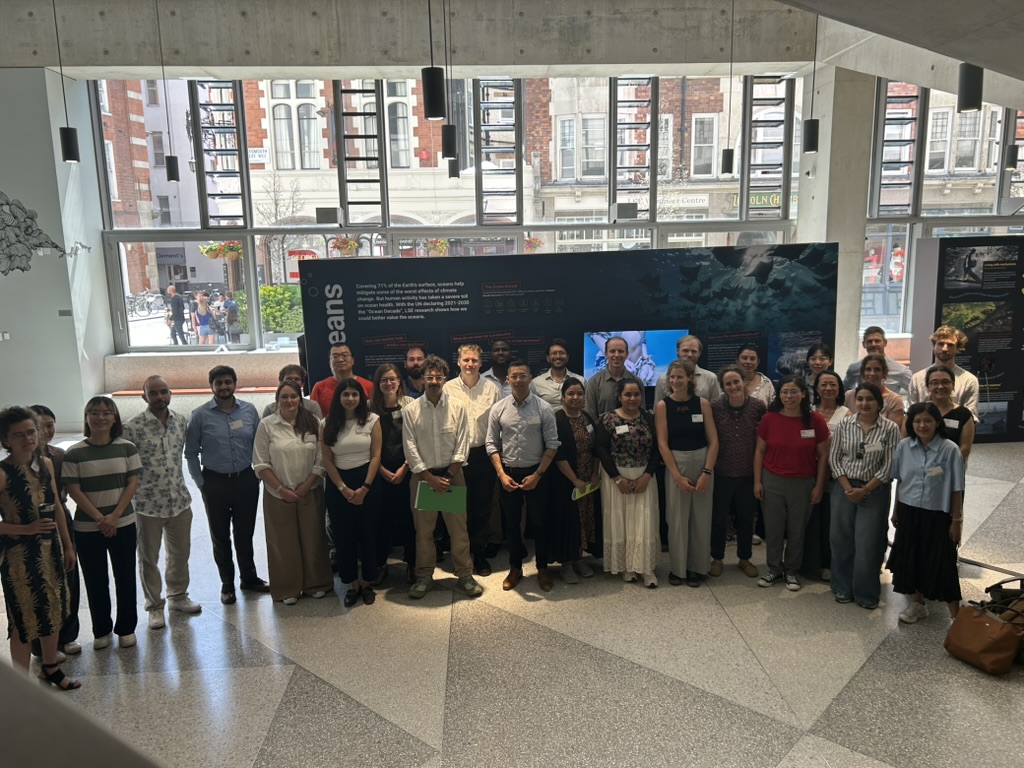
Last month (22–24 June), the FloodTraces team — Elisabetta Pietrostefani, Matt Mason, Andrea Nasuto, Martina Pardy, and Francisco Rowe — supported by the Geographic Data Science Lab, hosted the FloodTraces policy workshop and hackathon in partnership with the Humanitarian and Stabilisation Operations Team (HSOT) and IOM’s Displacement Tracking Matrix (DTM), with support from Imago — SDR UK Imagery Data Service and the LSE International Inequalities Institute.
The Goal
FloodTraces builds an integrated data pipeline that collects, integrates, and processes diverse data types — traditional sources like surveys alongside digital trace data including GPS, social media, and satellite imagery — to produce comprehensive assessments of displacement during major floods.
The pipeline generates policy-oriented Situation Reports and Data Fact Sheets, tested against 2024–2025 floods in Indonesia, Colombia, and Pakistan. Over three days, we set out to stress-test our outputs with a policy and operational audience, bring partners like IOM, FCDO, Meta, Flowminder, and WorldPop into the conversation during London Climate Action Week, and grow the SitRep library through the hackathon itself.
The Challenge
Hackathon teams picked from three problem statements, all rooted in the Pakistan case: refining the Digital Traces methodology, building an interactive version of a SitRep, and exploring anticipatory, early-warning approaches using historical flood data. Full briefs are on the event site.
Winning Team: Replicate and Refine
Congratulations to our winning team — Shaonlee Patranabis, Anna Zanchetta, Nannan Wei, Edith Darin, Jiaming Yu, Mouad Khoubbane, and Lisa Lim Ah Ken — who took on the “Replicate and Refine” brief: adapting the Colombia and Indonesia Digital Traces methodology to the August 2025 Sialkot floods, where roughly 125,000 people were evacuated after India’s release of Tawi River dam water.
Combining Meta mobility data with VIIRS nighttime light satellite imagery, they delivered a Situation Report that:
- Quantified displacement fast — an estimated 71,000+ people displaced by 28 August, within the pipeline’s target 24-hour turnaround.
- Mapped displacement patterns, showing population decline concentrated north and northwest of Sialkot, matching the flood extent.
- Tracked inflow into Gujranwala and neighbouring districts, pointing to where displaced populations were likely landing.
- Identified immobility pockets within the flood zone — priority areas for ground assessment.
- Flagged the most vulnerable areas through nighttime light data, showing displacement concentrated in low-economic-activity zones.
The result: a replicable methodology that could deploy within 24–48 hours of a future flood event, giving IOM and OCHA operations exactly the kind of early, spatially disaggregated picture that was missing in Sialkot.
What We Took Away
A few themes surfaced again and again across the three days, and they’ll shape where FloodTraces goes next:
- Interoperability is still the bottleneck. Displacement data is more available than ever, but fragmented systems, inconsistent definitions, and mismatched administrative boundaries keep organisations from building on each other’s work.
- “Available” doesn’t mean accessible. Digital trace data has never had more potential, but most of it — from mobility signals to connectivity data — sits with private companies. Access is often ad hoc, non-standardised, and dependent on individual relationships rather than durable partnerships, which makes it hard to build response systems you can actually rely on when the next flood hits.
- Geospatial, digital trace, and AI methods are opening real doors — from satellite imagery to AI-assisted extraction from unstructured reports — but participants were clear-eyed that validation, transparency, and responsible use have to keep pace.
- Good methods aren’t enough on their own. Turning analysis into something a humanitarian actor can actually use means designing with end users in mind and communicating uncertainty honestly, not burying it.
- None of this holds without investment in people and standards — local capacity, shared definitions, stronger data governance, and innovation that stays grounded in the needs of the people being displaced.
A Word on Satellite Data
The Sialkot case is a good reminder of what satellite imagery brings to this work that mobility data alone can’t. Nighttime light didn’t just confirm where people had moved — it told us who was left behind, and how exposed they were before the flood ever hit. That’s the layer that turns a displacement map into a vulnerability map. As FloodTraces grows, access to consistent, high-quality satellite imagery — like the kind Imago provides — stays central to making that possible.
Thank You
None of this happens without the people who show up to build it. Huge thanks to every participant who pushed this work forward:
Hong T., Ruzivo Kahonde, Laurence Hawker, Andrea Aparicio-Castro, Yu Han, Oluwatosin Orenaike, Ana Varela Varela, Jin Rui, Hafiz Muhammad Tayyab Bhatti, Munazza Usmani, Antigoni Karaiskou, Kate Hodkinson, Yassine Kerkeni, Meg G. McGrath, Wenlan Zhang, Jinal Jain, Linus Bengtsson, Fahad N., Prithvi Hirani, and more.
And to our partners — HSOT, IOM DTM, Imago, and LSE International Inequalities Institute — thank you for backing a workshop built to close a real gap in humanitarian response.
This is a strong foundation. More updates on SitReps and the wider framework coming soon.
All information about the event: pietrostefani.github.io/floodtraces-hack